Introduction
Description: The Innova SDS43 delivers real-time monitoring of hundreds of Parameter Identification Data (PID) for all vehicle systems. It captures essential data like voltage, RPM, temperature, and speed, along with system statuses such as open loop, closed loop, and fuel system status. This information is used by the vehicle’s computer for precise adjustments and corrections. The Scan Tool presents real-time data for each supported sensor, actuator, switch, and system status.
Benefits: Real-time access to PID Data enhances the ability of technicians to monitor and diagnose vehicle systems with greater precision. By offering in-depth insights into critical parameters, the SDS43 helps quickly identify and resolve issues, streamlining the diagnostic process and improving repair outcomes.
Instructions
NOTE: This procedure is carried out on a 2015 Chevrolet Equinox L4, 2.4L (VIN 8th = K).
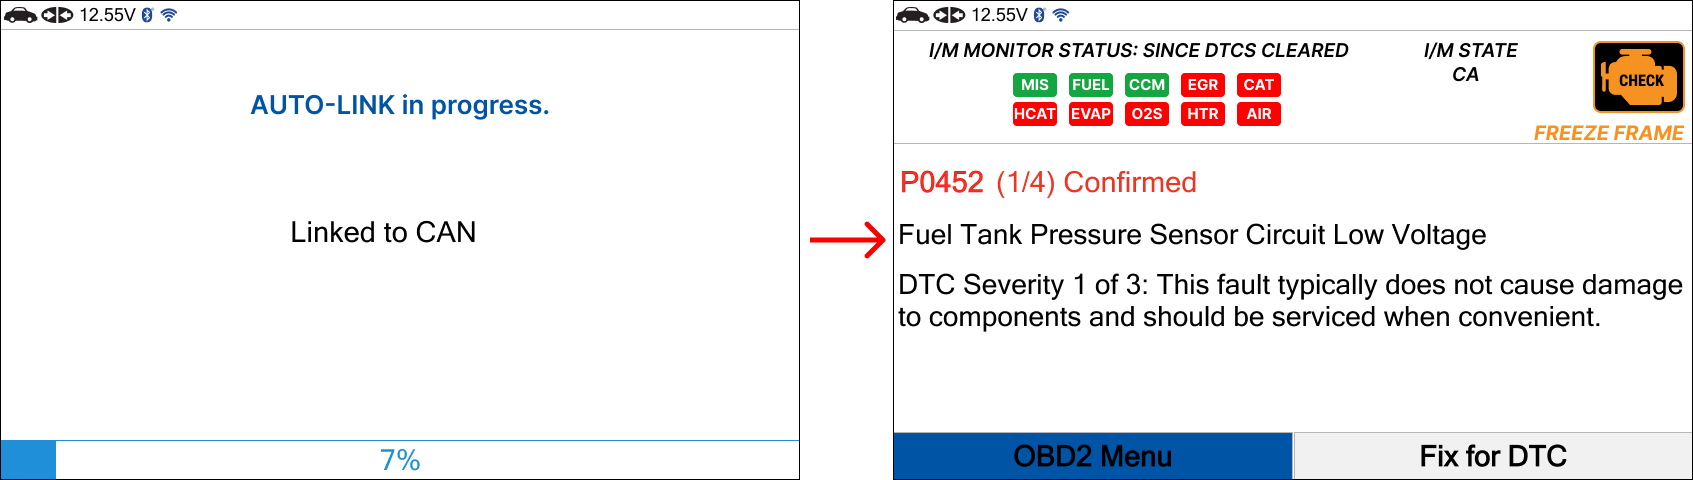
Step 1: Connect the Innova SDS43 to the vehicle via the 16-pin Data Link Connector (DLC). Allow the AUTO-LINK process to complete. Once finished, the Read DTCs screen will appear. Press the Home button.
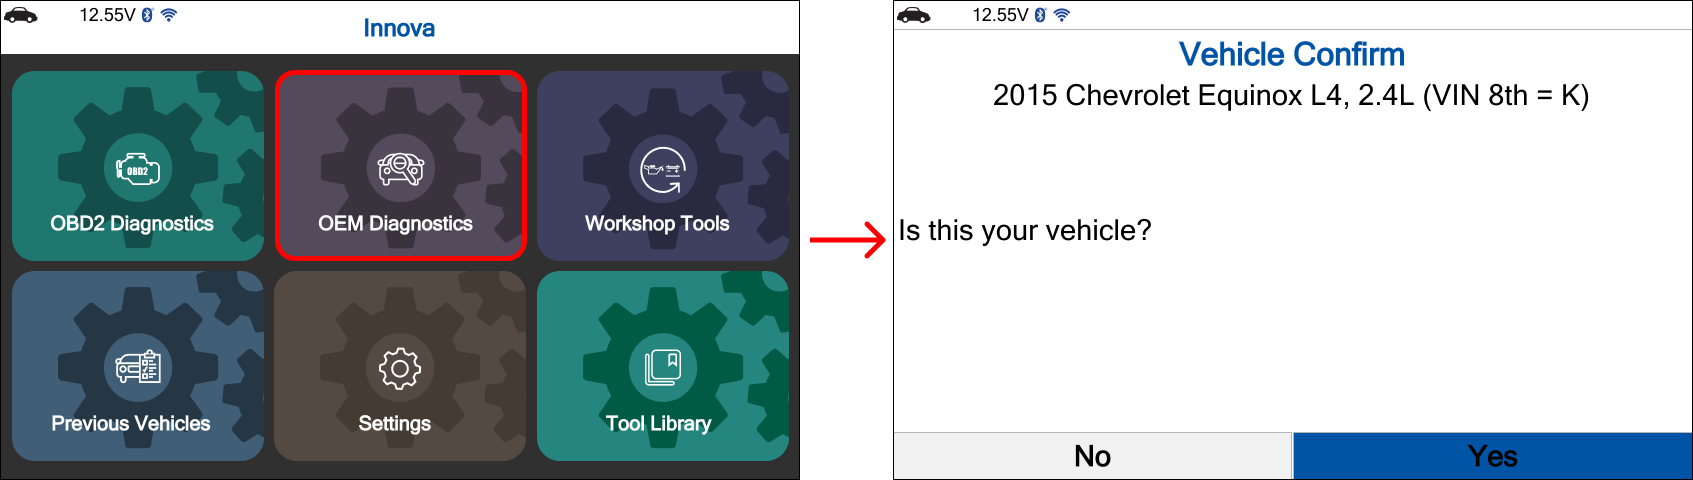
Step 2: Use the navigation button to select the OEM Diagnostics tab, then press the OK button. The Vehicle Confirmation screen will appear.
If the displayed information is correct, select Yes.
If the information is incorrect, select No and manually enter the vehicle details.
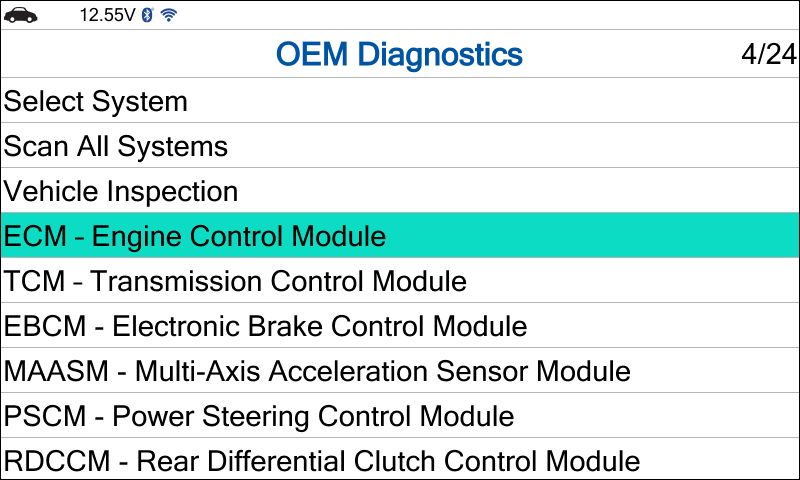
Step 3: Select the desired system to view Live Data, then press the OK button.
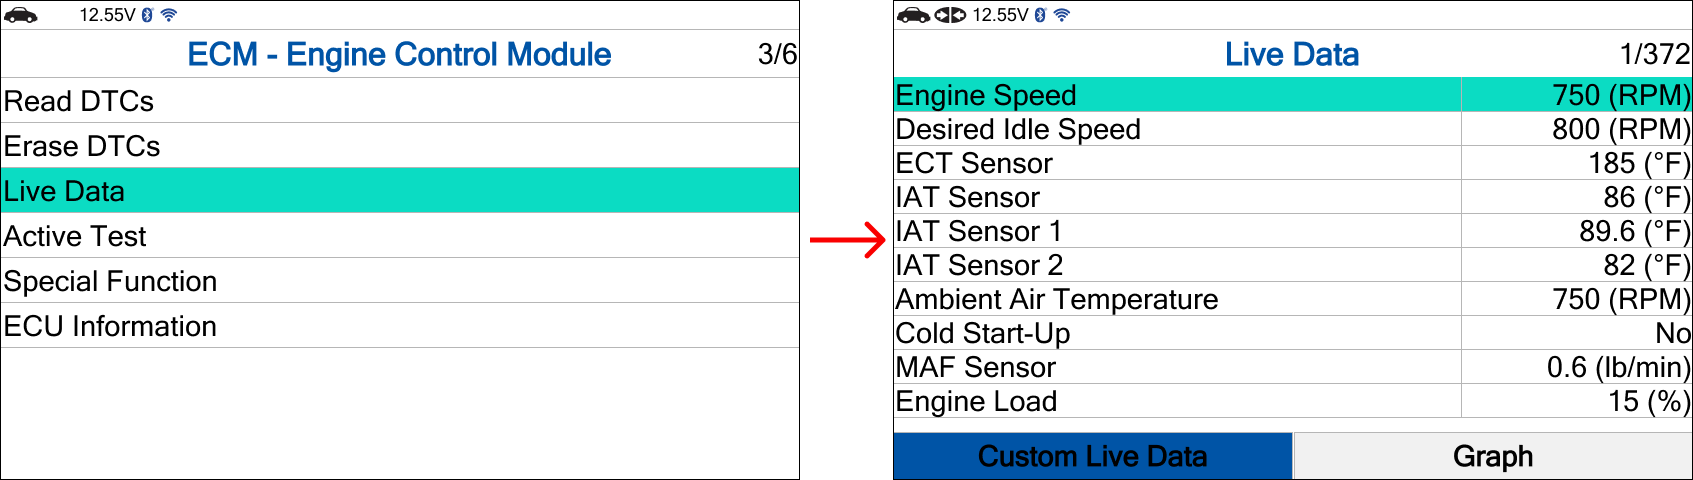
Step 4: Select Live Data, then press the OK button. The Live Data screen will be displayed. Select Custom Live Data, then press the OK button to customize the Live Data displayed on the screen.
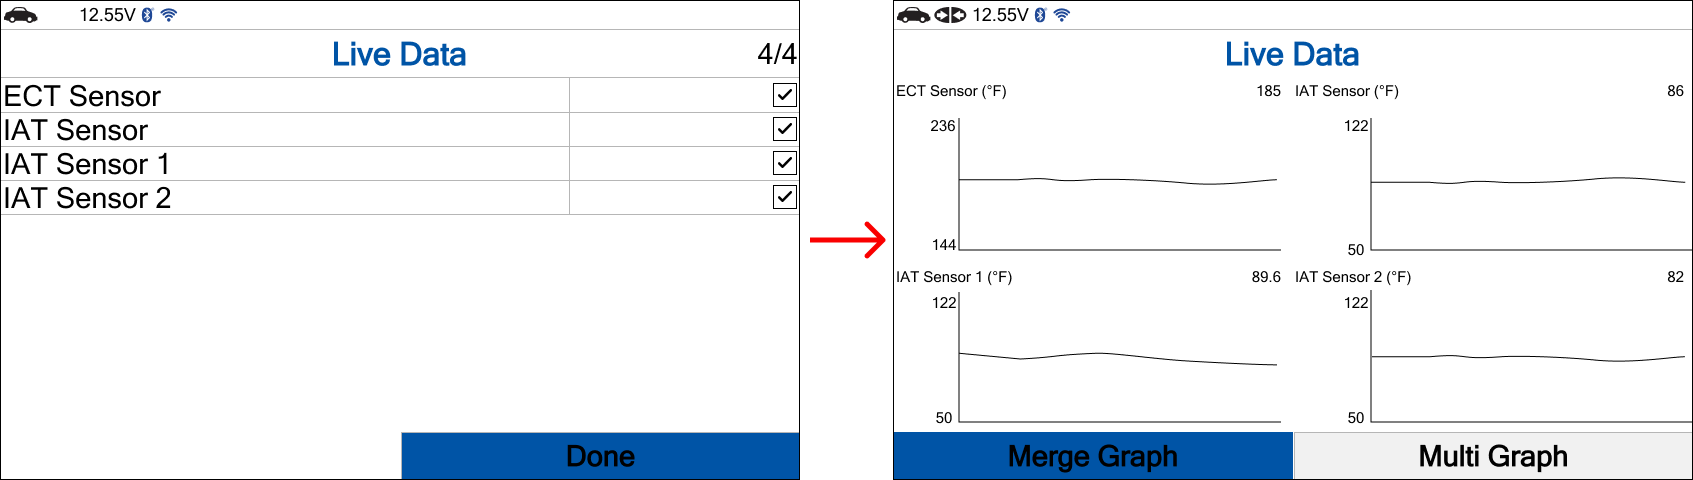
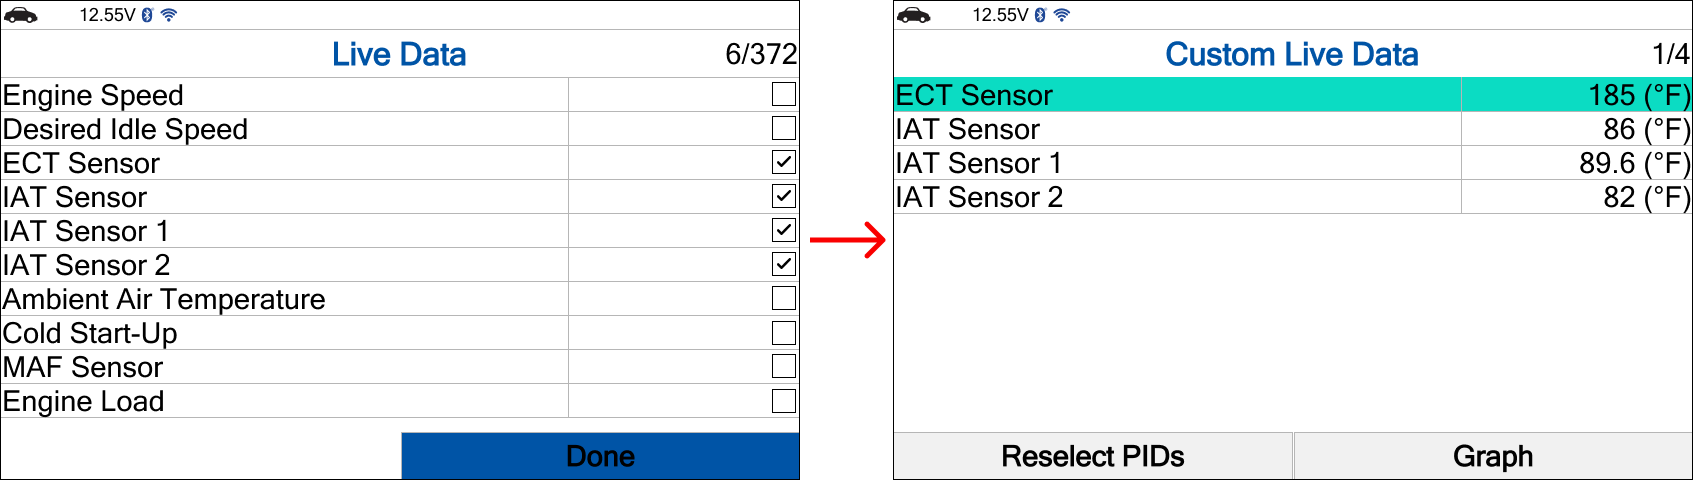
Step 5: Tick the box next to the desired PID, then select Done and press the OK button. The selected PIDs you wish to view will be displayed on the screen.
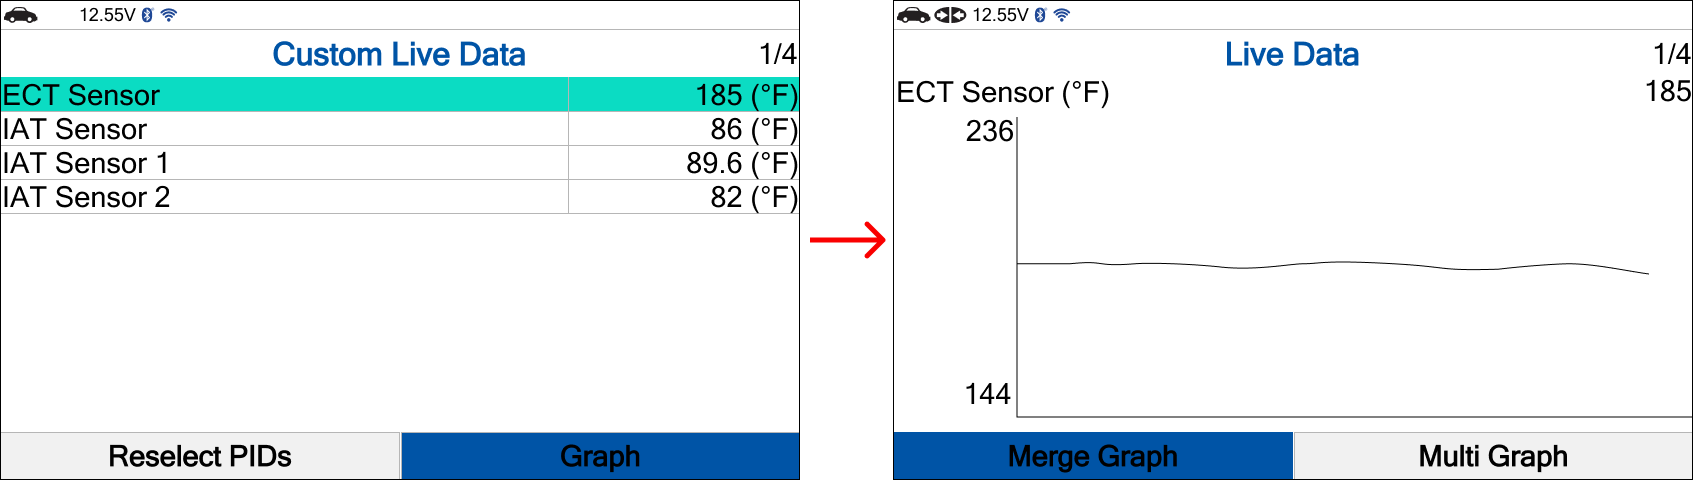
Step 6: Select Graph, then press the OK button to view PID in a graph.
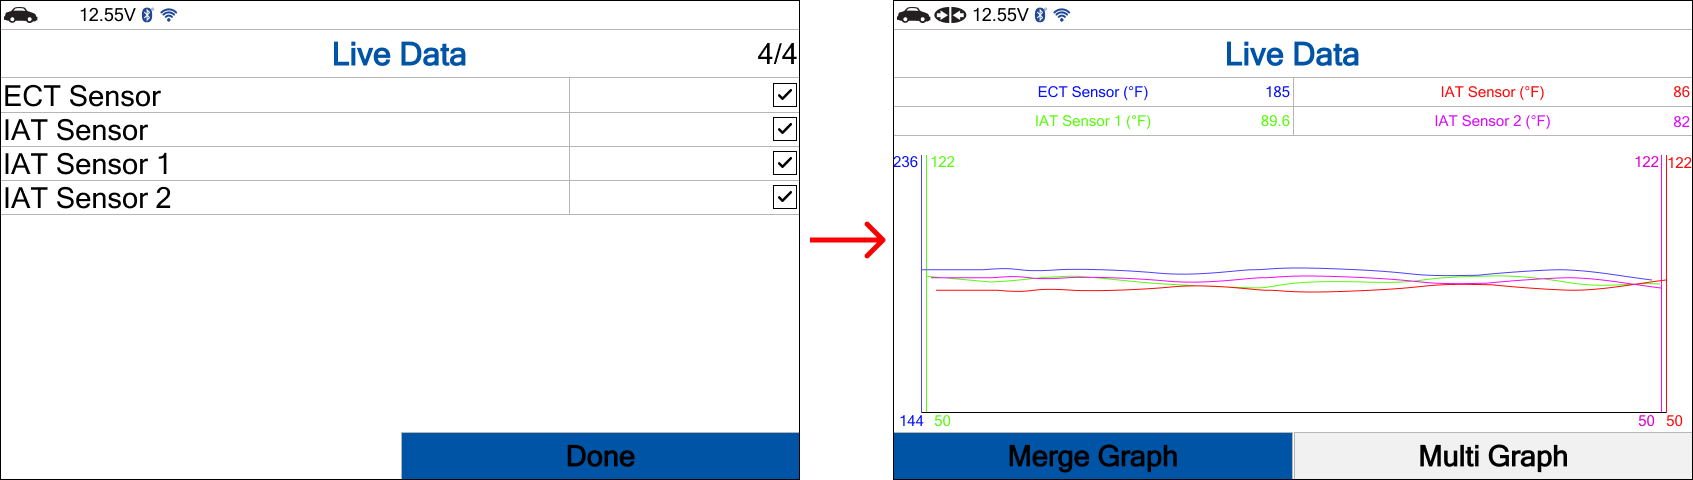
Step 7: Select Merge Graph, then press the OK button to add multiple PIDs to the graph. Tick the box next to the desired PID, then select Done and press the OK button. The selected PIDs will be displayed in the graph.
Step 8: Select Multi Graph, then press the OK button to view multiple graphs. Tick the box next to the desired PID, then select Done and press the OK button. The graphs of the selected PIDs will be displayed.